Join us on Tuesday 1 October for Digging the Data: MPs, Councillors and Elections where we’ll be exploring the fascinating world of political representation in the UK. Register here.
The July election brought big changes across the UK, as did the local elections before them in May. But what data is out there about our political representatives, and what can this data show us?
This post introduces some of the resources out here, as well as introducing some work we’ve been doing to make more data openly available. We have focussed on England, where we are based.
How do we know who’s in charge?
It can be confusing to wrap your head around the different representatives we get to choose. This guidance on local government structure and elections gives a handy introduction to some of the people we get to elect in England.
There is a lot of information out there about our elected representatives, but it isn’t always easy to get your hands on – particularly for local government.
What have we been up to?
Over the last few months we’ve been using support from the Manchester Statistical Society to open up more data about Councillors. This work is an updating of something we created a few years back.
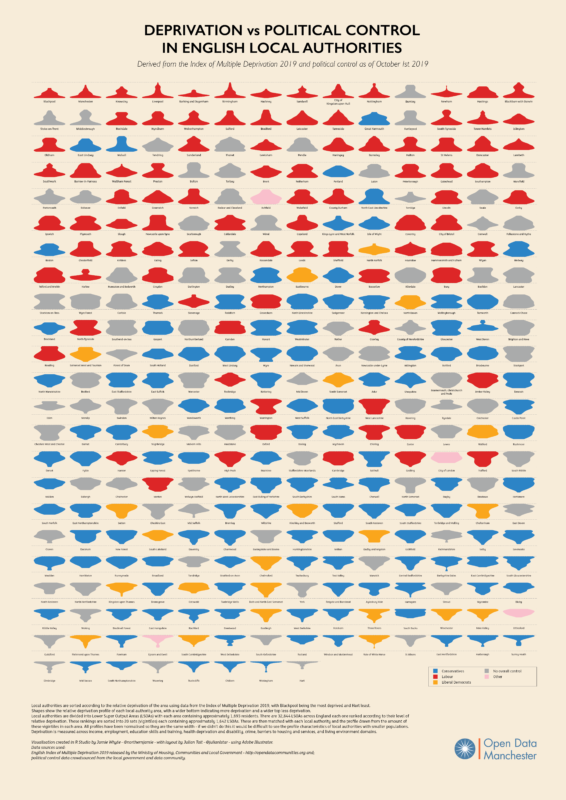
The aim of this work is to make it easier to find out the results of council elections across England, and to help people explore the relationship between the political make-up of local areas and how deprived these areas are in comparison to others.
As the results of Council elections are published individually by each Council is can be hard to get a detailed picture of local election results across England as a whole. In previous years we had to rely on scraping this data from council websites. This year we’ve not had to rely on scraping the data alone as Open Council Data have collated this data themselves and made it freely available.
We then linked results from individual wards with data on the relative deprivation of smaller areas called LSOAs. This data was taken from the English Indices of Deprivation. LSOAs and wards don’t neatly match up, but there is an ONS dataset that uses ‘best-fitting’ to link LSOAs up with wards. Using this, we have created a dataset that allows you to explore the relationship between the relative deprivation of local areas across England, and ward-level election results matched to these areas.
How can you explore the data?
You can freely download this dataset of local election results linked to levels of relative deprivation on our GitHub, including information about how it was created and what it can be used for.
You can also access datasets we created in previous years, including the script used to scrape the data.
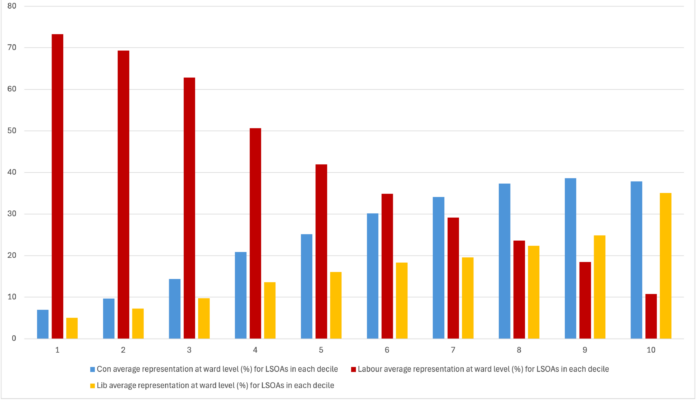
We have also been experimenting with ways of showing trend in this data, such as the draft graph below. There will be more coming soon.
What else is out there?
There are handy sources of data out there, and some great examples of making this easy to explore:
- Democracy Club are a goldmine of data on elections and representatives. They compile a database of who is standing for election in all elections in the UK above parish level, and the results of these elections. This includes by-elections (which happen outside the usual cycle of elections). Using this to work out who is currently in power is a little complicated and we hear rumours they may be making this information easier to access in the future.
- Open Council Data, a site run by Lawson Data Services Ltd. have compiled freely available datasets of councillors across the UK after the May elections, going back several years. The Local Elections Archive Project is a similar resource that publishes election results going back further in time and incorporating by-election results, though does not have full results for recent years.
- mySociety’s TheyWorkforYou is a great resource for finding out who your MP is, how they voted on issues that matter to you, and how to get in touch.
- The House of Commons library have created a nifty tool for exploring the relationship between the make-up of a local area and the party these places elect. They also have a dashboard for exploring data about parliamentary constituencies.
- You can access the Register of MPs financial interests on the Parliament website, and use an Electoral Commission tool to explore candidate spending for Parliamentary elections (at time of publication the latest data is for 2019). In a similar vein Who Targets Me gathers and publishes data about what political parites are spending on online advertising.
- For the election buffs, our friends at Open Innovations have created a hex map of the 2024 general elections results, with each constituency shown as an equal size. They have also shared resources for creating your own hex maps.
- And there is a lot of data these sources can be linked up with. For example, census data includes everything from religion to the location of second homes. And the English Indices of Deprivation included data on a range of measures, as well as an overall score and rank (there are different measures for other nations in the UK).
We will be exploring some of these resources (and others) at our event on the 1st October, making connections between data and each other, and seeing what we can find out and create. If you’d like to learn more then come along.
Not based nearby but want to connect about the work we are doing? Do drop us an email at hello@opendatamanchester.org.uk or you can sign up to our monthly newsletter.
To keep this blog up to date we may add in some more resources over time. If there is something great we’ve missed then let us know. (This blog was edited on 30th September & 4th October 2024 to add in further resources, as well as making sections about our work more concise.)